
|
Every tax is a pay cut. Every tax cut is a pay raise.
Citizens for Limited Taxation |

|


|
Debt is one way of meeting present needs by mortgaging future revenues.
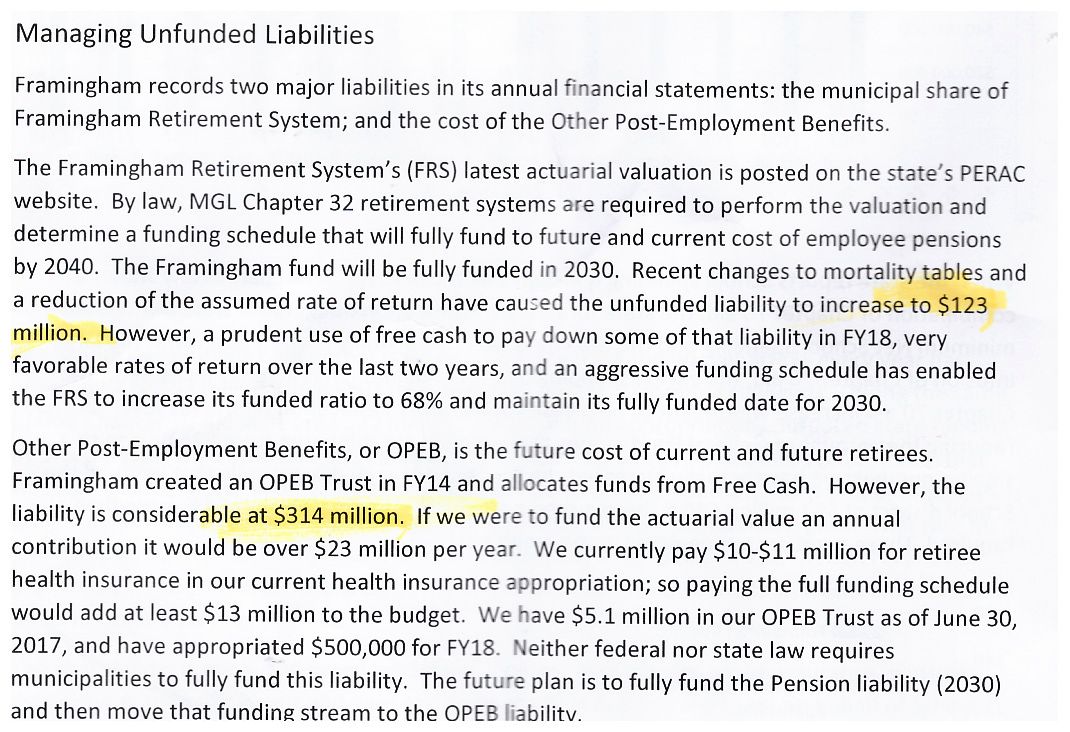
The ability to pile on debt at low interest rates with few consequences leads to complacency. The city of Framingham pledges its full faith and credit to repay their general onligation bonds, but as debt increases quickly, their promise seems to be depreciating in value. |
| Long Term Debt Authorized and Issued (inside debt limit) | ||||
|---|---|---|---|---|
| Year Ending | Beginning Balance | New Issue | Retired | Ending Balance |
| 07/01/2016 | 98,374,394 | 21,306,314 | 9,420,183 | 110,260,524 |
| 07/01/2015 | 98,857,399 | 9,762,932 | 10,245,938 | 98,374,394 |
| 07/01/2014 | 95,702,898 | 12,636,243 | 9,481,742 | 98,857,399 |
| 07/01/2013 | 94,303,479 | 12,953,862 | 11,554,443 | 95,702,898 |
| 07/01/2012 | 80,361,159 | 30,784,458 | 16,842,138 | 94,303,479 |
| 07/01/2011 | 45,826,213 | 40,344,559 | 5,809,614 | 80,361,159 |
| 07/01/2010 | 46,096,722 | 5,829,000 | 6,099,558 | 45,826,213 |
| 07/01/2009 | 40,361,428 | 12,095,591 | 6,360,246 | 46,096,722 |
| 07/01/2008 | 26,053,991 | 18,465,872 | 4,158,435 | 40,361,427 |
| 07/01/2007 | 30,400,946 | 275,572 | 4,622,527 | 26,053,991 |
| 07/01/2006 | 29,694,352 | 5,087,360 | 4,380,767 | 30,400,945 |
| 07/01/2005 | 25,516,225 | 8,870,550 | 4,692,425 | 29,694,352 |
| 07/01/2004 | 27,040,474 | 8,417,750 | 9,941,999 | 25,516,225 |
| 07/01/2003 | 29,228,526 | 1,913,529 | 4,101,581 | 27,040,474 |
| 07/01/2002 | ||||
| 07/01/2001 | 6,306,000 | 5,576,636 | 30,485,076 | |
| 07/01/2000 | ||||
| Long Term Debt Authorized and Issued (outside debt limit) | ||||
|---|---|---|---|---|
| Year Ending | Beginning Balance | New Issue | Retired | Ending Balance |
| 07/01/2016 | 80,854,077 | 24,560,463 | 6,853,728 | 98,560,812 |
| 07/01/2015 | 68,417,148 | 19,346,765 | 6,909,836 | 80,854,077 |
| 07/01/2014 | 64,224,042 | 11,031,882 | 6,838,776 | 68,417,148 |
| 07/01/2013 | 41,922,340 | 30,000,862 | 7,699,160 | 64,224,042 |
| 07/01/2012 | 47,037,643 | 5,115,303 | 41,922,340 | |
| 07/01/2011 | 36,310,414 | 14,816,675 | 4,089,446 | 47,037,643 |
| 07/01/2010 | 32,572,760 | 7,212,000 | 3,474,346 | 36,310,414 |
| 07/01/2009 | 35,086,141 | 18,164,900 | 20,678,281 | 32,572,760 |
| 07/01/2008 | 37,667,752 | 550,835 | 3,132,446 | 35,086,141 |
| 07/01/2007 | 40,782,864 | 0 | 3,115,112 | 37,667,752 |
| 07/01/2006 | 38,757,469 | 4,752,766 | 2,727,371 | 40,782,864 |
| 07/01/2005 | 37,881,120 | 3,278,835 | 2,402,486 | 38,757,469 |
| 07/01/2004 | 36,107,406 | 3,844,850 | 2,071,136 | 37,881,120 |
| 07/01/2003 | 37,731,128 | 497,500 | 2,121,222 | 36,107,406 |
| 07/01/2002 | ||||
| 07/01/2001 | 7,027,180 | 8,028,657 | 37,994,407 | |
| 07/01/2000 | ||||
| Long Term Authorized but not Issued | |||
|---|---|---|---|
| Year Ending | Beginning Balance | Recissions/ Additions/ Retired | Balance Unissued |
| 07/01/2016 | 164,196,889 | 40,783,285 | 123,413,604 |
| 07/01/2015 | 139,589,119 | 24,607,770 | 164,196,889 |
| 07/01/2014 | 127,390,278 | 139,589,119 | 07/01/2013 | 108,655,673 | 127,390,278 |
| 07/01/2012 | 116,073,065 | 108,655,673 | |
| 07/01/2011 | 116,073,065 | 110,066,128 | |
| 07/01/2010 | 152,148,023 | 116,073,065 | |
| 07/01/2009 | 74,447,568 | 152,148,023 | |
| 07/01/2008 | 55,758,356 | 74,447,568 | |
| 07/01/2007 | 23,687,600 | 55,758,356 | |
| 07/01/2006 | 100,455,569 | 76,767,969 | 23,687,600 |
| 07/01/2005 | 83,157,822 | 65,909,826 | 17,553,196 |
| 07/01/2004 | 73,824,301 | 58,936,224 | 14,888,077 |
| 07/01/2003 | 67,056,696 | 3,588,124 | 63,468,872 |
| 07/01/2002 | |||
| 07/01/2001 | 96,091,150 | 62,796,500 | |
| 07/01/2000 | |||
| Short Term Debt | ||||
|---|---|---|---|---|
| Year Ending | Beginning Balance | Issued | Retired | Ending Balance |
| 07/01/2016 | 40,556,882 | 16,159,372 | 40,556,882 | 16,219,372 |
| 07/01/2015 | 48,826,001 | 38,248,174 | 46,417,293 | 40,356,882 |
| 07/01/2014 | 44,737,282 | 42,033,842 | 37,945,123 | 48,826,001 |
| 07/01/2013 | 50,721,098 | 41,594,386 | 47,578,202 | 44,737,282 |
| 07/01/2012 | 61,070,644 | 50,721,098 | 61,070,644 | 50,721,098 |
| 07/01/2011 | 91,152,653 | 35,917,901 | 65,999,910 | 61,070,644 |
| 07/01/2010 | 24,821,076 | 94,082,653 | 27,751,076 | 91,152,663 |
| 07/01/2009 | ||||
| 07/01/2008 | ||||
| 07/01/2007 | ||||
| 07/01/2006 | ||||
| 07/01/2005 | ||||
| 07/01/2004 | ||||
| 07/01/2003 | ||||
| 07/01/2002 | ||||
| 07/01/2001 | ||||
| 07/01/2000 | ||||
| Unfunded Liabilities | ||
|---|---|---|
| Year Ending | Retirement | Health Insurance/ (OPEB) |
| 07/01/2017 | 123,000,000 | 314,000,000 |
| 07/01/2016 | 110,444,086 | 288,645,575 |
| 07/01/2015 | 110,444,086 | 288,645,575 |
| 07/01/2014 | 95,314,038 | 202,000,000 |
| 07/01/2013 | 95,314,038 | 202,000,000 |
| 07/01/2012 | 95,314,038 | 202,000,000 |
| 07/01/2011 | 95,314,038 | 202,000,000 |
| 07/01/2010 | 66,000,000 | 280,000,000 |
| 07/01/2009 | 66,000,000 | 216,000,000 |
| 07/01/2008 | ||
| 07/01/2007 | ||
| 07/01/2006 | ||
| 07/01/2005 | ||
| 07/01/2004 | ||
| 07/01/2003 | ||
| 07/01/2002 | ||
| 07/01/2001 | ||
| 07/01/2000 | ||
| Legal Debt Margin/Accounting Principles |
|---|
| The Town is subject to
Chapter 44, Section 10
ofthe
General Laws of the Commonwealth of Massachusetts
which limits
the amount of bonded debt the Town may have outstanding to
5 percent of the valuation of taxable property
as last equalized by the Commonwealth's Department
of Revenue (see valuations at: Tax Rates ).
One significant departure from Generally Accepted Accounting Principles that the town has is as follows: Long term debt has some level of interest associated with it. Long term liabilities are not interest bearing, but are at the whims of the stock market and may be inflation protected. General fixed asset acquisitions (non-enterprise) are not capitalized in a general fixed asset group of accounts. This becomes significant when you take into account all the unused real estate the town owns . |
| Commentary |
|---|
| To better understand the $431 million, scale it down to numbers
you can understand. The annual town revenues, 2010: $235 million.
Basically, if you were making $75,000 a year, you would be $150,000
in debt.
This debt/liability indicates that we have already spent two years worth of future revenues. Do we continue to spend like drunken sailors or do we just plain stop borrowing? Framingham's per capita debt stands at $6,630 for every man, woman and child (assuming a town population of ~68,000). Having all these debts and liabilities may be construed as a non-trivial indicator that we are not living within our means despite the alleged claims of our financial wizards in Framingham's Ministry of Finance. I have to suspect that if a national healthcare plans passes, the the taxpayers liabilities will increase. In general, government interference only makes things more expensive. Enzo Rotatori tried his best to scale down Framingham's growing public sector unions and their ballooning size in this article. In Framingham, it's a million here, a million there and soon we're talking serious money ($431 million debt). In Massachusetts, it's a billion here, a billion there and soon we're talking serious money ( $66 billion debt ). In the U.S., it's a trillion here, a trillion there, and soon we're talikng serious money ($53 trillion including SS and Medicare/Medicaid). |
Send comments to:
 hjw2001@gmail.com
|

|