|
Every tax is a pay cut. Every tax cut is a pay raise.
Citizens for Limited Taxation |

|


|
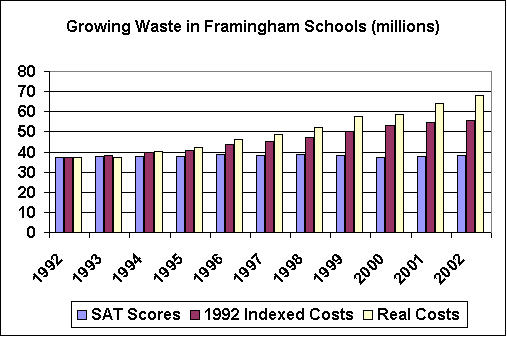
This graph basically shows the real school costs against the
costs we would have paid taking into account the student head
count increases and using Proposition 2 1/2 guidelines
for cost increases. The SAT scores are also shown to indicate
that increased costs result in no increase in scores. In essence,
this graph shows that even if we double costs, scores will not
improve. The conclusion is that we are feeding the teacher's
unions but not improving the education of our children.
We are pouring money into a black hole.
This is like buying increasingly expensive shares of a company whose revenues are flat or declining. The table and explanation below shows how I derived this graph. |
| Year | 1992 | 1993 | 1994 | 1995 | 1996 | 1997 | 1998 | 1999 | 2000 | 2001 | 2002 |
|---|---|---|---|---|---|---|---|---|---|---|---|
| Indexed SAT scores | 37.15 | 37.61 | 37.98 | 37.80 | 38.52 | 38.41 | 38.77 | 38.16 | 37.22 | 37.55 | 38.26 |
| 1992 Indexed Costs | 37.15 | 38.45 | 39.76 | 40.76 | 43.65 | 45.22 | 47.26 | 50.32 | 53.32 | 54.41 | 55.76 |
| Real School Costs | 37.15 | 37.31 | 40.37 | 42.28 | 45.98 | 48.70 | 51.98 | 57.88 | 58.83 | 64.33 | 67.85 |
| Total SAT Scores | 1033 | 1046 | 1056 | 1051 | 1071 | 1068 | 1078 | 1061 | 1035 | 1044 | 1064 |
| Student Head Count | 7,418 | 7,491 | 7,558 | 7,558 | 7,897 | 7,980 | 8,137 | 8,453 | 8,739 | 8,700 | 8,698 |
| The 1992 Indexed Costs are calculated starting with the 1992 school
expenditure figure of $37.15 (millions) when the schools had
7,418 students.
My first index (index1) is the student count on any year divided by 7,418. For the year 2002, it would be 8,698 / 7,418 = 1.1725532. My second index (index2) is the Proposition 2 1/2 index. I compute the number of years since 1992. For 2002, it would be 10. I take the value 1.025 and multiply it by itself by 10. For the year 2002, it would be 1.025 ** 10=1.28. I then take the 1992 school expenditure level of $37.15 (millions) and multiply it by index1, then multiply that result by index2 to calculate the 1992 Indexed Costs. For 2002, the 1992 Indexed Cost is 37.15 * 1.1725532 * 1.28 = 55.76. The Indexed SAT Scores were derived to fit the graph by taking the 1992 actual school costs of $37.15 (millions) and dividing it by the Total SAT Scores for 1992. This came out to 37.15 / 1033 = .035963213. Each annual total SAT score was multiplied by this factor to get the Indexed SAT scores. |
Send comments to:
 hjw2001@gmail.com
|

|