
|
Every tax is a pay cut. Every tax cut is a pay raise.
Citizens for Limited Taxation |

|

| The fiscal year ends on June 30 of that year. Fiscal 2007 ends on June 30, 2007 |
|---|
| Fiscal Year |
Number of students | Number of teachers | Teachers aides/ assistants | Total School Staff | Teachers salaries (millions) | Average teacher's salary | Aides/ Assistants salaries (millions) | Total School Costs (millions) | Cost per Student | Student/ Teacher Ratio | Students per Adult | Senior SAT Verbal Scores | Senior SAT Math Scores | Senior SAT Writing Scores | Total SAT Score |
|---|---|---|---|---|---|---|---|---|---|---|---|---|---|---|---|
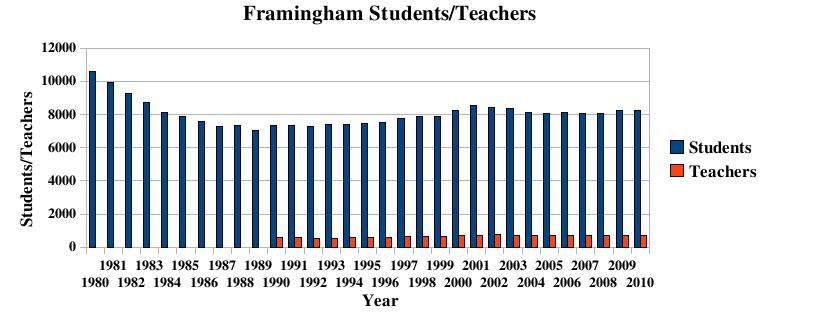
| 1990 | 7,305 | 604 | 995 | .9 | 37.068 | 5,074 | 12.1 | 7.3 | |||||||
| 1991 | 7,305 | 577 | 58 | 944 | 23.3 | 40,381 | .9 | 38.073 | 5,223 | 12.7 | 7.7 | ||||
| 1992 | 7,289 | 549 | 40 | 867 | 23.1 | 42,076 | .9 | 37.150 | 5,096 | 13.2 | 8.4 | 514 | 519 | 1033 | |
| 1993 | 7,418 | 542 | 43 | 855 | 22.8 | 42,081 | .9 | 37.312 | 5,029 | 13.7 | 8.7 | 518 | 528 | 1046 | |
| 1994 | 7,374 | 567 | 47 | 891 | 23.8 | 42,000 | 1.0 | 40.370 | 5,474 | 13.0 | 8.3 | 523 | 533 | 1056 | |
| 1995 | 7,431 | 598 | 59 | 955 | 25.1 | 41,897 | 1.0 | 42.279 | 5,689 | 12.4 | 7.8 | 520 | 531 | 1051 | |
| 1996 | 7,504 | 610 | 67 | 980 | 26.9 | 44,062 | 1.1 | 45.978 | 6,127 | 12.3 | 7.7 | 528 | 543 | 1071 | |
| 1997 | 7,758 | 641 | 71 | 1,025 | 28.0 | 43,681 | 1.1 | 48.704 | 6,277 | 12.0 | 7.6 | 526 | 542 | 1068 | |
| 1998 | 7,851 | 675 | 80 | 1,083 | 29.0 | 42,962 | 1.3 | 51.977 | 6,620 | 11.6 | 7.2 | 529 | 549 | 1078 | |
| 1999 | 7,893 | 674 | 82 | 1,089 | 31.5 | 46,805 | 1.4 | 57.881 | 7,333 | 11.7 | 7.3 | 522 | 539 | 1061 | |
| 2000 | 8,242 | 690 | 79 | 1,118 | 33.6 | 48,979 | 1.6 | 58.826 | 7,137 | 11,9 | 7.4 | 507 | 528 | 1035 | |
| 2001 | 8,518 | 716 | 94 | 1,123 | 34.6 | 50,144 | 1.6 | 64.334 | 7,553 | 11.9 | 7.6 | 511 | 533 | 1044 | |
| 2002 | 8,391 | 742 | 138 | 1,158 | 37.5 | 50,480 | 1.9 | 67.851 | 8,086 | 11.3 | 7.2 | 526 | 538 | 1064 | |
| 2003 | 8,364 | 726 | 127 | 1193 | 39.4 | 54,330 | 2.7 | 73.837 | 8,827 | 11.5 | 7.0 | 531 | 554 | 1085 | |
| 2004 | 8,102 | 692 | 137 | 1157 | 38.0 | 54,913 | 2.7 | 71.739 | 8,854 | 11.7 | 7.0 | 513 | 533 | 1046 | |
| 2005 | 8,065 | 701 | 140 | 1178 | 39.9 | 56,918 | 2.9 | 73.182 | 9,074 | 11.5 | 6.9 | 524 | 541 | 1065 | |
| 2006 | 8,124 | 721 | 153 | 1213 | 40.6 | 56,310 | 3.4 | 75.533 | 9,297 | 11.3 | 6.7 | 509 | 541 | 507 | 1050/1557 |
| 2007 | 8,085 | 701 | 155 | 1181 | 41.1 | 59,788 | 3.6 | 78.216 | 9,674 | 11.5 | 6.8 | 510 | 545 | 509 | 1055/1564 |
| 2008 | 8,038 | 710 | 159 | 1193 | 43.6 | 62,831 | 3.8 | 82.952 | 10,320 | 11.3 | 6.7 | 501 | 515 | 494 | 1016/1510 |
| 2009 | 8,153 | 716 | 164 | 1200 | 45.2 | 63,128 | 4.1 | 87.746 | 10,670 | 11.5 | 6.8 | 522 | 563 | 524 | 1085/1609 |
| Fiscal Year |
Number of students | Number of teachers | Teachers aides/ assistants | Total School Staff | Teachers salaries (millions) | Average teacher's salary | Aides/ Assistants salaries (millions) | Total School Costs (millions) | Cost per Student | Student/ Teacher Ratio | Students per Adult | Senior SAT Verbal Scores | Senior SAT Math Scores | Senior SAT Writing Scores | Total SAT Score |
| 2010 | 8,153 | 721 | 153 | 1194 | 49.8 | 66,593 | 4.4 | 86.246 | 10,500 | 11.4 | 6.9 | 511 | 547 | 509 | 1567 |
| 2011 | 8,182 | 708 | 153 | 1157 | 49.9 | 66,593 | 4.5 | 88.696 | 10,500 | 11.4 | 6.9 | 513 | 527 | 509 | 1549 |
| 2012 | 8,172 | 703 | 153 | 1157 | 51.8 | 66,593 | 4.5 | 90.637 | 10,500 | 11.4 | 6.9 | 512 | 552 | 512 | 1579 |
| 2013 | 8,201 | 703 | 153 | 1157 | 51.8 | 66,593 | 4.5 | 90.637 | 10,500 | 11.4 | 6.9 |
Notes
|
| Class Size Issues |
|---|
| If you ask the school superintendent what the average
class size
is, he will say about 20. The numbers below were extracted
from the school system reports. It's tough to argue with
any issue of accuracy.
Is class size important? Simple answer: No! |
| If you examine the 2002-2003 school year calendar as presented on
their web site, you
will discover that the average teacher works 180 days (and this
doesn't include any vacation time or sick leave that teachers may
get).
I computed my working year (12 holidays, 3 weeks vacation, 2 weeks sick leave) and I work 224 days a year. The average annual salary in 2003 for Framingham teachers was greater than $53,000. This doesn't include their summer job salary. If I were a full-time teacher in Framingham, I'd be earning (224 / 180 ) * $53,000 = $65,955. According to the U.S. Census Bureau, the median household income in Framingham is $54,288. Notice the correspondence between their growing salaries and the SAT scores of their students. |
| If you accept the Superintendent of Schools statement that the average class size is indeed 20, then we can calculate the number of teachers we should have if know the number of students. In 2002, we had 8698 students. Dividing this by 20 gives us 435 teachers. The school system reported having 742 teachers. What do the other 307 teachers do for a living? |
| The SAT test has been available for 30 years. Traditionally,
about 85% of Framingham students take it, and as such, it is a
better measure of general academic performance. The maximum
score is 800 in both the math and verbal parts. The numbers
in the table above were drawn both from the state department of
education and the annual review that Boston Magazine does on Boston
area schools. Note that the increasing costs in schools
does not correlate at all to any better results.
As a side note, Northeastern University only admits students who have scored over 600 in each part. |
Send comments to:
 hjw2001@gmail.com
|

|