|
Every tax is a pay cut. Every tax cut is a pay raise.
Citizens for Limited Taxation |

|
Framingham Town Government Growth Rates |
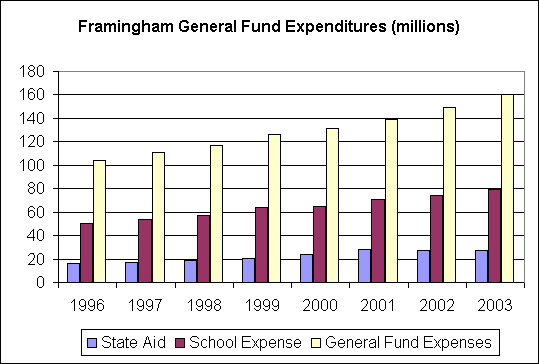
| The Town of Framingham was incorporated in the year 1700. It has grown steadily for over 300 years. In the year 1996, the General Fund exceeded $100 million for the first time. Sadly, seven years later, we have reached the $160 million mark, achieved thru very rapid growth. |
| Proposition 2 1/2 limits the increase in taxation that Framingham
is allowed to 2.5%. In the past several years, Framingham has
grown far beyond the 2.5% limit thru the use of abundant
state aid.
From 1996 thru 2003, the cost of Framingham town government has
grown by 55%. This includes 50% pay raises for most senior town
officials. Now that the state aid
is drying up, they are asking
the voters to support the significantly larger town government
thru an operational override.
In the same time frame, the town's population has grown by a mere three percent (3%). Take note that the operational override for $7.5 million just passed is five percent (5%) of the the General Fund expenditures. The override request doubles the limit imposed by Proposition 2 1/2. This implies that the town government will grow by seven and a half percent next fiscal year. In essence, since Proposition 2 1/2 was enacted, the state has allowed the towns and cities to circumvent it by dramatically increasing state aid to municipalities. |
| If the town government provides it's employees with a pay
increase greater than 2.5%, they do so knowing full well that
the required money is not guaranteed via
state aid.
Basically, would you base your food purchases and mortgage payment on your salary or your bonus check? The state aid is a bonus check. |

Framingham Expenditures (in millions). General Fund only |
||||||||
|---|---|---|---|---|---|---|---|---|
| Year | 1996 | 1997 | 1998 | 1999 | 2000 | 2001 | 2002 | 2003 |
| State Aid | 15.9 | 16.4 | 18.5 | 20.1 | 23.9 | 27.9 | 27.6 | 27.1 |
| General Fund Expenditures | 102.2 | 111.3 | 116.5 | 126.1 | 131.6 | 139.0 | 149.0 | 160.0 |
| Growth Rate | 8.3% | 8.9% | 4.7% | 8.2% | 4.4% | 5.6% | 7.2% | 7.3% |
| Population | 66,141 | 66,333 | 66,525 | 66,717 | 66,910 | 66,692 | 66,474 | 66,256 |
| Public Safety | 14.2 | 15.1 | 15.2 | 16.5 | 18.3 | 17.9 | 18.3 | 19.6 |
| Public Works | 7.7 | 7.9 | 7.4 | 7.3 | 7.1 | 8.3 | 8.0 | 7.8 |
| Debt Service | 3.5 | 5.0 | 4.6 | 5.9 | 6.8 | 8.8 | 8.3 | 8.7 |
| School Expenditures | 50.7 | 54.9 | 57.7 | 61.7 | 65.1 | 70.2 | 74.6 | 79.4 |
| School Expense Growth Rate | 8.3% | 8.2% | 5.1% | 6.9% | 5.5% | 7.8% | 6.3% | 6.4% |
| School Enrollment (est.) | 8,422 | 8,420 | 8,672 | 8,993 | 9,289 | 9,250 | 9,223 | 9,223 |
| MCAS ranking | 143/271 |
Send comments to:
 Harold J. Wolfe
|

|